• Home
  • About Me
  • Blog
  • Contact
  • Login
LMS@tradesandtikes.com
Login

Login
Mommy Day Trader-Become Consistent in trading Stocks,Forex,Futures Mommy Day Trader-Become Consistent in trading Stocks,Forex,Futures
  • Home
  • About Me
  • Blog
  • Contact
  • Login

Why Did It Pop (SPY)

Home ChartsWhy Did It Pop (SPY)
Why Did It Pop (SPY)

Why Did It Pop (SPY)

January 21, 2016 Posted by LMS Charts, Day Trader, Mentoring, SPY, Strategy No Comments

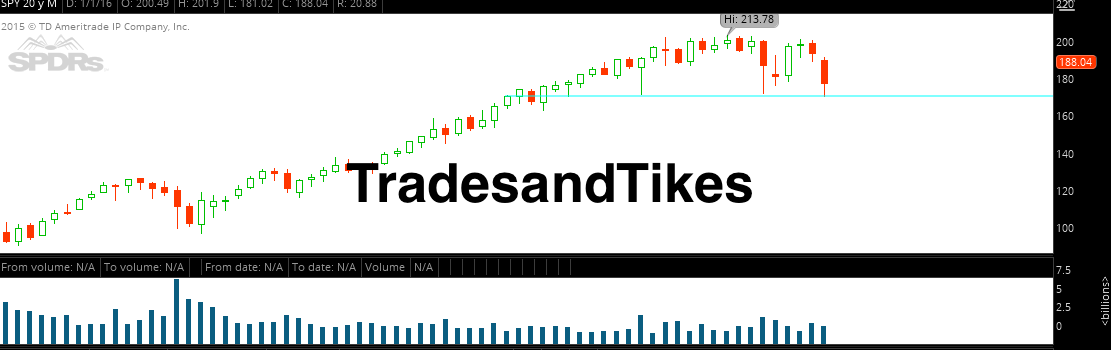
In order to filter out all the noise we have to look at the big picture. The big picture will be looking at a larger time frame like the Monthly Chart.  We can look back at Nov.2013 month’s closing price which is $181.00.  This price is significant within the candle because it’s the move which sets a bound for the rest of the weeks going forward. It’s the junction of the next levels. It is also the Candle where many price areas were tested within the following 3 months after.  As the Spy climbed along its “merry” way, we had a few significant tail test, near $181 but not exact. The first one came on April of 2014, then the infamous Oct. 2014 lows- all which resulted in a bounce.  The August low of 2015 was close but held firmly above the 182.40 mark.  If you look back enough in time, and you are familiar with how the market dynamics work, you could have foreseen SPY retest of $181. all before the New year.

On Jan.20th, yesterday’s low was $181.02. Bingo the retest of $181.

So the question is why the pop? Simply put:: buyers were waiting at that level for the POP also known as a “first touch”  For all the other tail test were not exact.  Above is a 15 minute chart, We will focus on the white area, (for the gray area is premarket) which shows the retest of the Blue line “Monthly 181 support”  You have your standard Candle stick reversal pattern with a Doji, then an engulfing green candlestick to follow— then the start of the flag patterns and the rest is history.

But realize it’s only a matter of time before the next retest -but perhaps the retest fails and breaks right through which will bring us to a targeted level of $174


Share on Google+Share on FacebookShare on LinkedInTweet about this on TwitterShare on RedditPin on PinterestShare on TumblrShare on StumbleUponEmail this to someone
Tags: chartsConceptlearningmarketsmentalitymentoringprofessionalpsychologySPYstrategy
No Comments
0
Share

About LMS

Day/Swing Trading Mentor.

You also might be interested in

How to back test a winning strategy

How to back test a winning strategy

Nov 5, 2015

The key to back testing is all about the historical[...]

Trade the Chart

Trade the Chart

Dec 24, 2015

Trading is only difficult when you bring your assumptions to the[...]

Coins add Up

Coins add Up

Jan 9, 2016

I have always been a saver and I was taught[...]

Leave a Reply

Your email is safe with us.
Cancel Reply

Advertisment

Subscribe to Blog via Email

Enter your email address to subscribe to this blog and receive notifications of new posts by email.

Portfolio:: Gains as Well as My Losses

Instagram

Instagram has returned invalid data.

Follow Me! In the Moment

Contact Us

We're currently offline. Send us an email and we'll get back to you, asap.

Send Message
~Become Consistently Profitable~
Logo
I can help you cut down your learning curve expeditiously!

Get started today.

Contact Info

  • LMS@tradesandtikes.com

Find Me

Fresh from blog

  • 2021 Update!
  • It’s Not about the Money!
  • h Pattern
  • The Concept of Day Trading
  • Hello 2018!
  • Consistency

© [2021] · www.tradesandtikes.com All Rights Reserved

  • Home
  • Disclaimer
  • Refund Policy/Terms
Prev Next