February Choppy Market
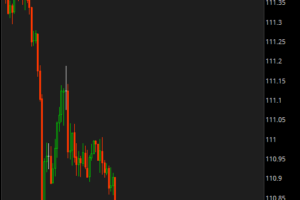
For the month of February I have noticed the change in the market dynamics on a shorter time frame. Many call it “chop” but technically it’s the way in which many levels are tested. In January, the market did a minor correction breaking through minor levels. In order to slow down the momentum of the fall, the market popped up once it hit a major level of Spy 181.00. Understanding progression in terms of volume progression and price action progression, by looking at past data, you can see how progression occurred to produce the resulting price action. “The price actions of lower time frames follow the trend of higher time frames”. If it doesn’t there is no trend.
Many traders will enter a trade only to get stopped out because they are following the higher time frames trend; and not understanding the lower time frames. The lower time frames moves in the opposite direction of their trade, stops them out, only then to move in their direction. The trader gets mad because they’ve failed to understand progression and momentum in terms of the lower time frames. The lower time frame have to work their way through the levels of support and resistance that may not be evident when looking at the higher time frames. The price action on the smaller time frame appears to be “chop” by the up and down movements when in essence it’s the means of building momentum. Understand that momentum is built up and lost to the upside or downside depending on the direction.
There is bullish and bearish momentum, both go through “progression” in order to result in the price action of the higher time frames trend.
I know many will read this and go huh? LOL, I can break it down further, it will be a lot to explain, but the point of this post is to rationalize the behavior of February’s “choppy” market behavior. However it is not chop, it’s just the process in which progression occurs even when looking at past historical data.