Parabolic Curve Pt. 2
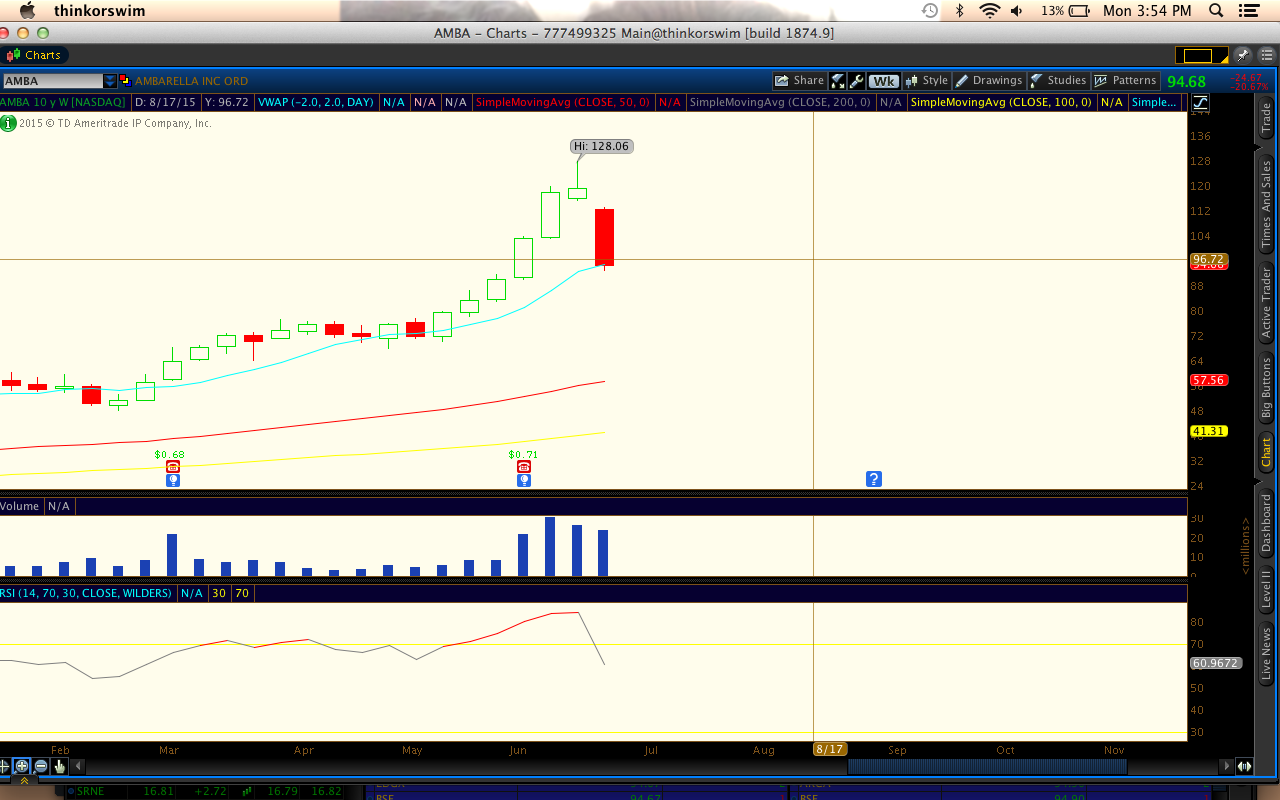
In a previous post I wrote about what a parabolic curve look like and also a live trade example of it with KITE. This time around I am going to discuss my 2nd trade that involves a parabolic curve, with a greater return because it was parabolic on the monthly and weekly chart. AMBA went completely haywire for two weeks without any pull backs of significance. (a 1-2% pull back is not a pull back for something that went up over 60% in one month- giving that 2 weeks alone attributed to the majority of that gain.) AMBA surged two days after its good earning results. There were no GAPS in the chart, just a great incline. At some point around $110/share AMBA was beginning to be irrational in price. The buyers or late chasers didn’t want to miss in on the action (causing a rise) and short sellers who were caught from a lower level were getting squeezed and covered- also resorting in a rise. AMBA did the unthinkable last week reaching a level of $125 with $128.06 on the nose being the highs. I added multiple times at $120, and $126, on top of a position I had at $115- My average per share was $120.33. On June 19th (expiration Friday) AMBA opened at $127 and closed at $119 which was nearly a 7% draw down. Resulting in a Weekly candle stick that appeared to be an inverted hammer/shooting star. The fun was just starting. Today a new week:: Monday morning AMBA instantly gapped down- taking out 2 entire weeks of gains in just one day with a 21% drop…. On AMBA’s monthly chart, June bar looks like a shooting star- the change in momentum is significant. JULY put buyers are smiling wide. I hate to say “I told you so” but I’ve told many so… I love these chart patterns and I look forward to the next one. I will try to bank in on both sides of the trades.
Cheers