My Favorite Pattern
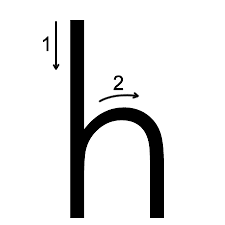
I find great success when I recognize this particular pattern before it even occurs. It’s called the “h” pattern, it’s rarely used amongst other traders, however I can spot this pattern on any time frame. It’s my bread and butter for easy money making.
The pattern occurs when the stock has a steep or sudden decline followed by a very weak bounce (all the following candles are inside bars) As the bounce begins to fail, the price formation resembles a lower-case “h”.
Many technical traders will trade any pattern based on a break. As in the break of support. I like to enter a trade before the break of support. With the h pattern, I will enter the short at the top/curve of the highs, with a stop way above the highest candle. As the stock begins to drop, I add to my position. The next stage is when the stock actually breaks support– my next add will be below support, therefore maximizing the profit potential.
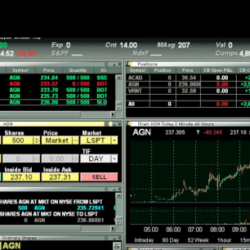
You are looking at AMZN 15 min chart- right where the arrow points, my entry was at the tail of the candle, with my stop above the second candle to the left of it. If you are familiar with candle stick analysis, you will understand that their are sellers at the wicks of those candles. This is a 15 minute time frame–just picture what the 5 min chart would tell you about the wicks. I explain candle sticks behavior thoroughly within the beginners course.
 Notice where the support occurs, the 11am candle stick is right at that level. The tail of the largest candle is $671, technically you shouldn’t have a position until the break (but that rule does not apply to me)
 Around 11:15am AMZN broke support. The large red bar is the result of technical traders entering this position at the break of support — this trade resulted in a $22/point move from my short call.
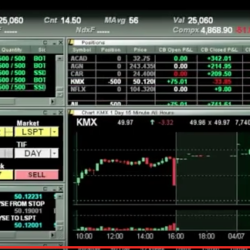
 DD::another “h” pattern on a 5min chart-
Smaller time frames, smaller the move- but still over $1.50/share =$1,500 in my book.
Preferably, a daily chart “h” pattern will result in substantial gains. We are talking about a Major move.